Vinkelkapen
-
Posts
3 -
Joined
-
Last visited
Vinkelkapen's Achievements
")
Newbie (1/14)
0
Reputation
-
 Vinkelkapen reacted to a post in a topic:
Log analysis improvement
Vinkelkapen reacted to a post in a topic:
Log analysis improvement
-
Yeah that's what I'm doing now, but sometimes I want to add some parameters or take away just for a fast check in the layout I'm using. The platform I'm using is not for tuning but for oem analysis/repair etc The vertical zoom i find kind of odd using, when zooming its zooming for what seams to be middle value of max and min and not what's displayed on screen, so when viewing low number and zoom vertically they disappear if zoomed to mutch... Is this something I can solve without going in and out of time plot parameters?
-
Ah! excellent must have missed that shortcut or not really thinked about it, it kind of zooms in an odd way though but it really helps to have that shortcut
-
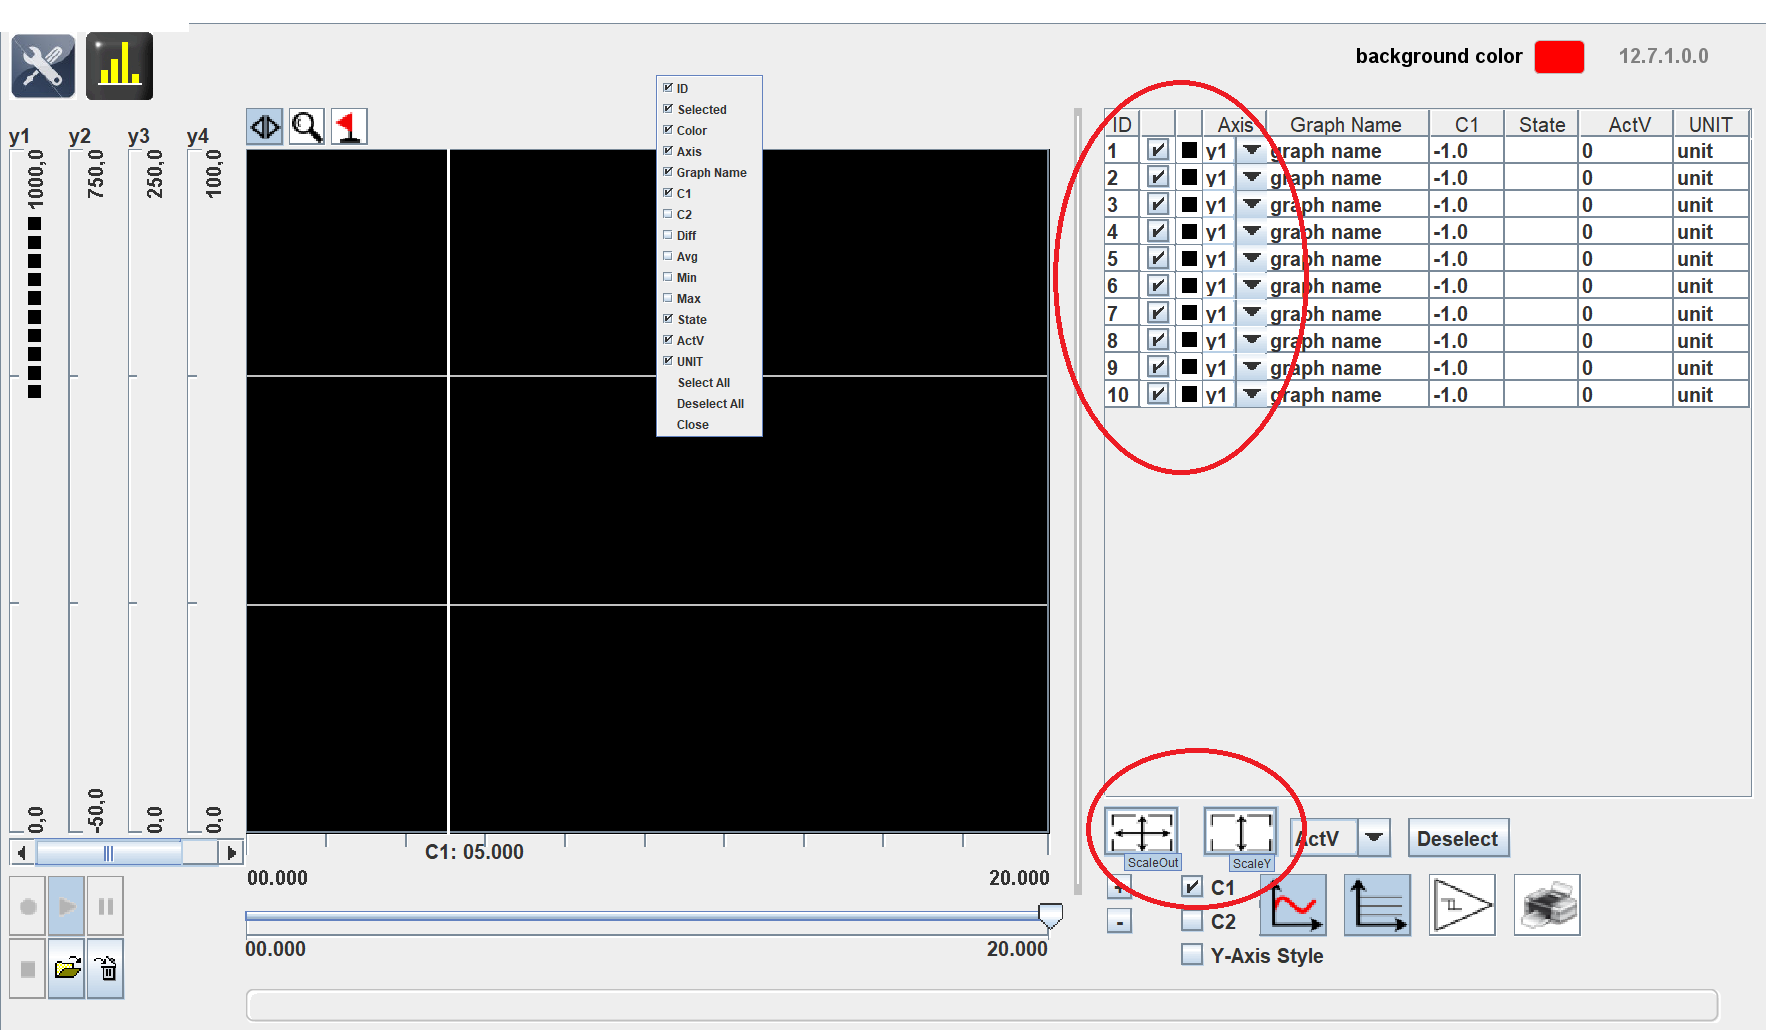
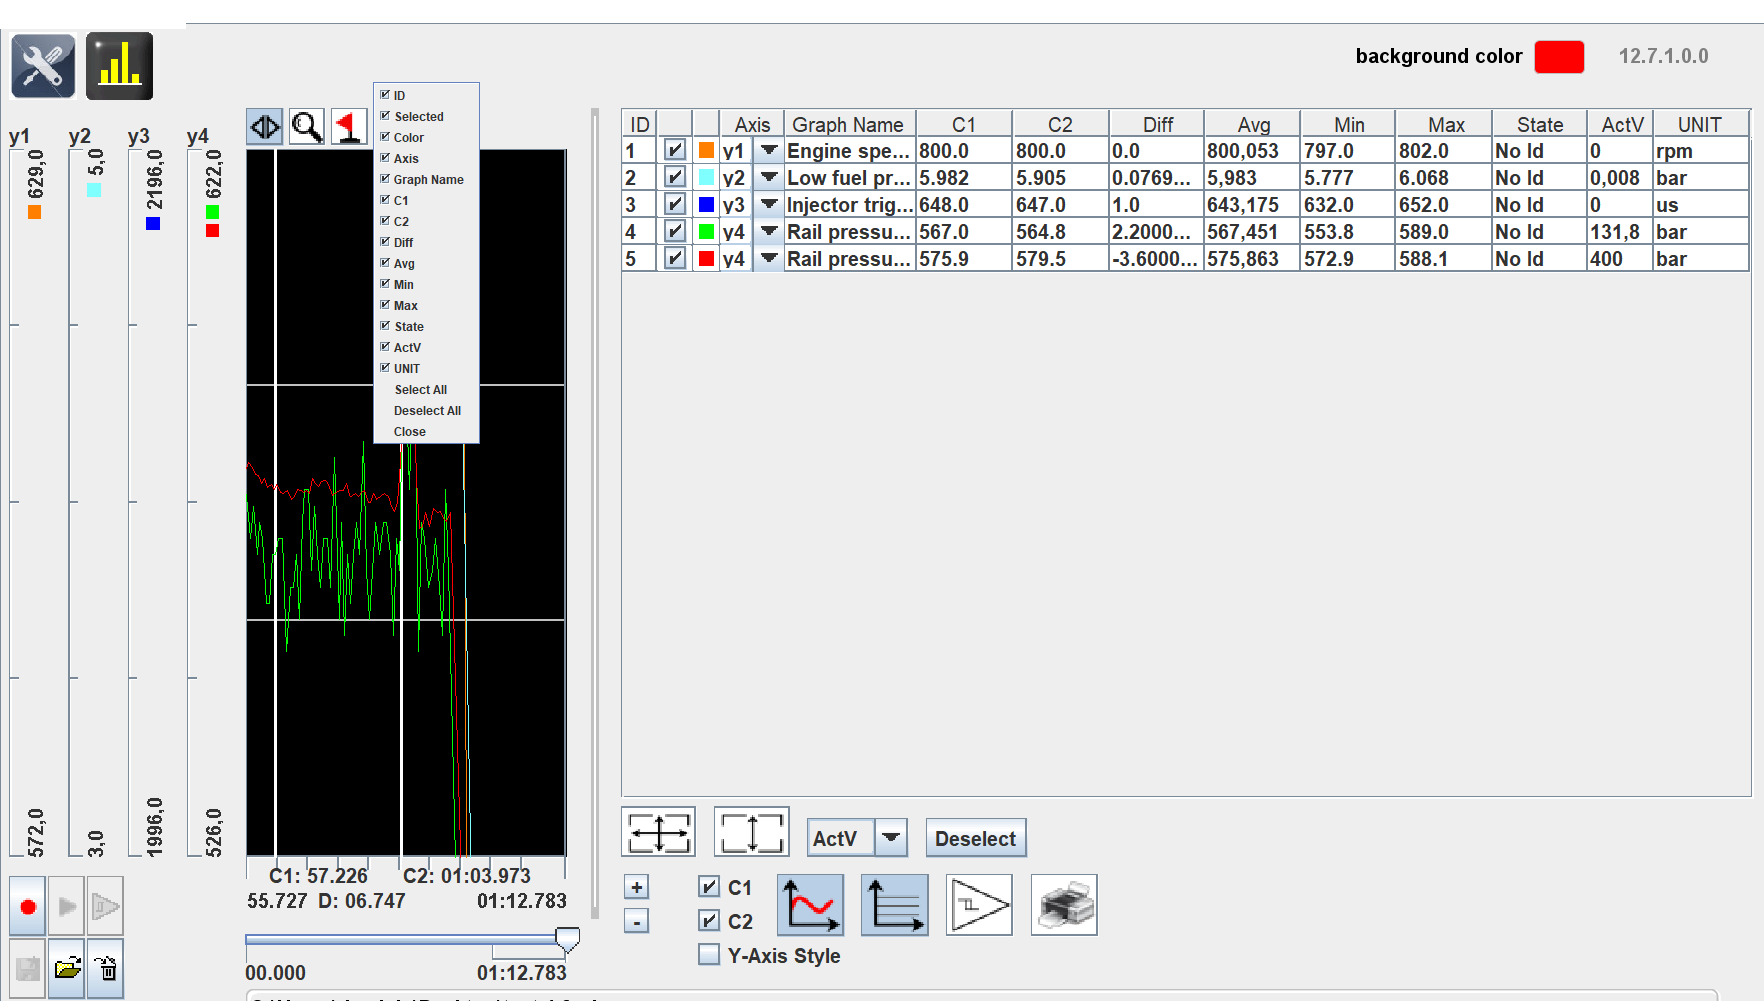
hi, been tuning these ECUs for a while and have a wish for improved log analysis instead of "time plot - parameters" where i select what parameters i want to view in the graph i would want a type of "parameter list" where i can add all parameters i want and then checkboxes besides them, to easily check or uncheck them right beside the graph in the layout view.. this would make it easier when seeing a problem and not knowing what it is to go through a lot of parameters one by one faster or even when you just want to check with high resolution and maybe only two parameters at a time, i know it is possible to add your own layout fields but this would be a improvement in how i working with logs. also the resolution is kind of hard to work around, i havent found a function for it.. so a button to change the min/max values in the field that is zoomed in woud be handy.. if for example viewing a parameter with high numbers but also small numbers that also have a big impact in some performance, when looking at these small numbers in zoomed in state the small numbers makes less sense in the graph due to too big min max values in zoomed in state, and if i want to see them in higher resoulution i again need to go to "time plot - parameters" and change the min max values i attached pic from a program i work in alot so my rambeling makes a little more sense